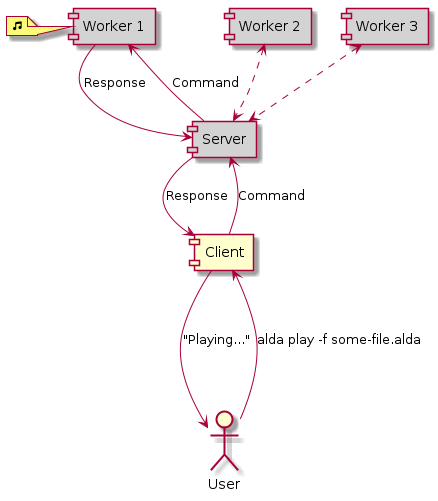
A coworker of mine introduced us to PlantUML a year or two ago and we used it to create an architecture diagram of our distributed systems. I revisited that old architecture diagram recently and I ended up making a bunch of tweaks and updates just for fun.
The PlantUML language is very intuitive, and it’s nice to be able to throw together a quick diagram just by editing text.
As an example, here’s the PlantUML source for a basic architecture diagram for Alda:
@startuml

actor User

[Client]

[Server] #lightgray

[Worker 1] #lightgray
note left
  <&musical-note>
end note

[Worker 2] #lightgray
[Worker 3] #lightgray

User ---> Client: alda play -f some-file.alda
Client -> Server: Command
Server -> [Worker 1]: Command
[Worker 1] --> Server: Response
[Worker 2] <..> Server
[Worker 3] <..> Server
Server --> Client: Response
Client -> User: ""Playing...""

@enduml
Running that through PlantUML produces this png file:

Things I like about this:
- I was able to write the source for this in very little time.
- I didn’t have to worry about adjusting the visual layout of all the nodes and arrows; I only needed to declare the relationships between the nodes, and PlantUML figured out where to place everything.
- PlantUML has a GUI mode where it displays the diagram output and continuously updates it as you make changes to the source. This made it easy for me to iterate on the diagram, observing the output as I made each change.
- The output actually looks halfway decent! It’s not the most beautiful thing in the world, but I think it’s good enough for everyday use.
The next time you find yourself wanting to make a quick diagram, give PlantUML a try!
Comments?
Reply to this tweet with any comments, questions, etc.!